· 11 min read Posted by Daniel Bertoldi
The One-Liner That Was Eating Our Memory

The JetBrains Jewel project recently got a report of a supposed memory leak
in the LazyTree Composable. Thankfully, the issue had a minimal reproducer that we could use to investigate
this weird behavior.
But the reproducer by itself is not enough, to effectively check if there are any memory leaks going on, we need specific tooling.
First of all, what is a memory leak? And what can we do about them?
The Context
In computer science, a memory leak is a type of resource leak that occurs when a computer program incorrectly manages memory allocations in a way that memory which is no longer needed is not released
Since Jewel is a Compose Multiplatform (CMP) library targeting Desktop applications, we need to find tooling specific for JVM.
There are many techniques that you can use to find memory leaks, from dumping the JVM heap from detailed garbage collection (GC) logging, to runtime monitoring and comparative analysis. If you want to know more about each of them, I highly recommend reading Elefetheria’s article on this topic.
There are many profilers that we can use for this, JetBrains has its own profiler bundled with their IDE, but it’s only available to Ultimate subscribers, but there are free alternatives that you can use. To find the memory leak for this report, I used the battle-tested Memory Analyzer Tool (MAT) by Eclipse. It’s not as straightforward to use as JetBrains’ profiler, but it gets the job done. MAT has a pretty powerful set of options you can use to analyze heap dumps, and the most useful for us is checking the retained heap for each class.
The Call
The reproducer looked something like this:
data class TestTreeNode(
    val foo: String,
    val bar: Int,
)

fun rebuildTree(elems: List<TestTreeNode>) =
    buildTree {
        elems.forEach {
            addNode(TestTreeNode("foo${it.foo}", it.bar), it)
        }
    }

fun expandElems(elems: List<TestTreeNode>): List<TestTreeNode> {
    val lastBar = elems.lastOrNull()?.bar ?: 1
    var newElems = listOf<TestTreeNode>()

    repeat(1024) {
        newElems += TestTreeNode(
            bar = lastBar + it,
            foo = "foo${lastBar + it}",
        )
    }

    if (elems.size > 1024) {
        newElems = newElems.drop(elems.size - 1024)
    }

    return newElems
}

@OptIn(ExperimentalJewelApi::class)
@Composable
internal fun TestTree() {
    Column(modifier = Modifier.fillMaxSize()) {
        var tree by remember { mutableStateOf(buildTree<TestTreeNode> { }) }
        val treeState = rememberTreeState()
        var elems by remember { mutableStateOf(listOf<TestTreeNode>()) }

        Column {
            OutlinedButton(
                onClick = {
                    elems = expandElems(elems)
                    tree = rebuildTree(elems)
                },
            ) {
                Text("Add many items")
            }

            LazyTree(
                tree = tree,
                treeState = treeState,
            ) {
                Row {
                    Text("bar ${it.data.bar}; foo ${it.data.foo}")
                }
            }
        }
    }
}
So, everytime we hit the “Add many items” button, the code would add 1024 new items to the LazyTree while dropping
the last 1024 items from the tree. This means that we’d never have more than 1024 items at once in our tree, so memory
allocations should stay the same regardless of how many times we “add” new items. The code is actively cleaning the list
of items from both the Composable tree and the mutable list that originally held them.
After running the reproducer and clicking on the “add many items” about seven times, it was time to finally check
what might be going on. The report we received said that we were referencing old data, so the most direct approach here
was to just check if we have a suspiciously high number of TestTreeNode or elements in our LazyTree.
The Evidence
The first step though is to dump the heap. Luckily, JDK bundles a handy tool called jcmd
that does exactly this. The thing though, is that you first need the PID of the application which jcmd has to
reference to dump the heap. Interestingly enough, if you run jcmd without any arguments it’ll list all JVM processes,
so you don’t even need another command or tool for this.
After you have the PID, then just run jcmd <PID> GC.heap_dump <PATH> and voilà, the heap dump will be stored in PATH.
By using GC.heap_dump, GC will run right before
creating the snapshot, so you can be sure that anything that’s in the heap is there because GC couldn’t sweep away.
Now, just open MAT and open the dump file in it.
The Facts
Like I said previously, we first need to check for suspiciously big numbers related to our code. Looking at the list of classes and their heap in the Histogram tab, we found this:
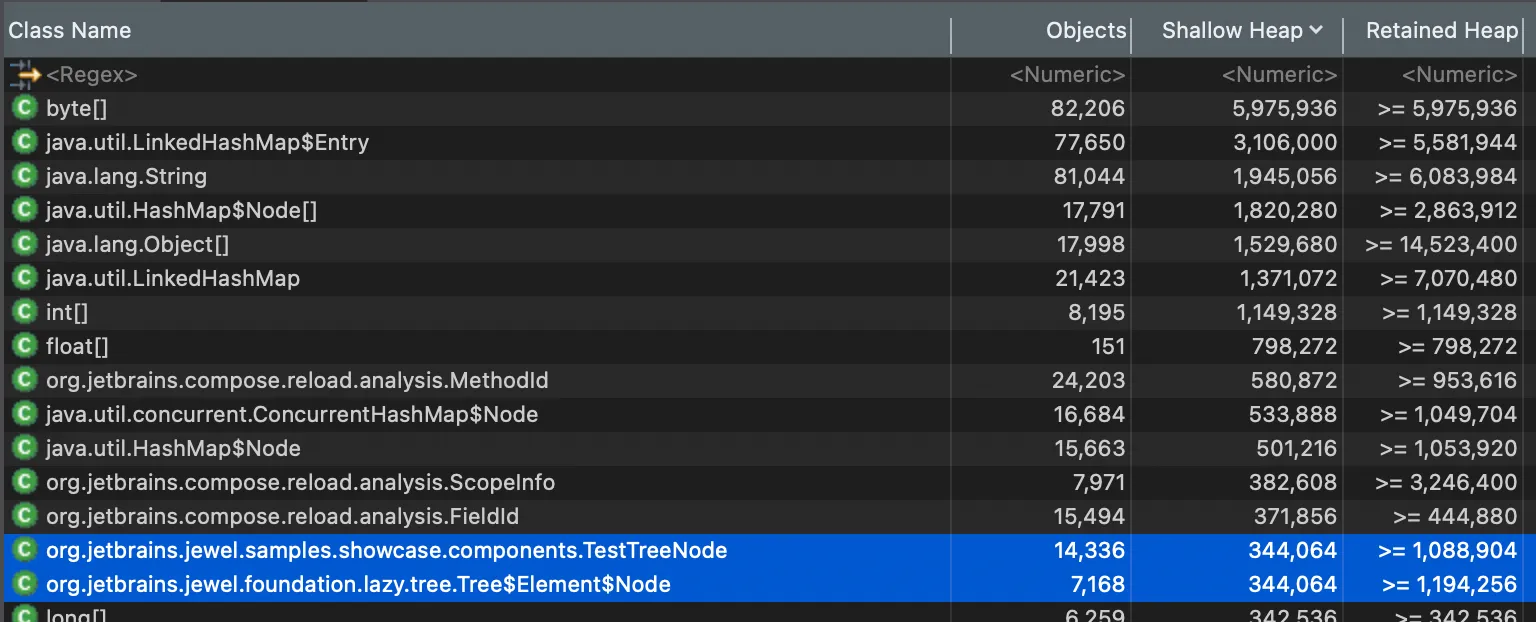
| Class Name | Objects | Shallow Heap (bytes) | Retained Heap (bytes) |
|---|---|---|---|
| TestTreeNode | 14,336 | 344,064 | >=1,088,904 |
| Tree$Element$Node | 7,168 | 344,064 | >=1,194,256 |
Which by itself is astounding. A little over 1MB in retained objects for what should be only 1024 items in our list. Also, see that our tree has over 7 thousand objects in memory, but it should’ve stopped at 1,024. Something is smelling very fishy here, but let’s dive a little bit deeper.
By the way, the difference between shallow and retained heap is that shallow shows the memory consumed by the object itself, isolated from everything else. Retained heap is the shallow heap of the object plus the shallow heap of all other objects that would be garbage collected if this specific object were deleted.
So, when the goal is to see why GC isn’t able to free memory that’s not needed anymore, MAT has a handy option that you can use called “Path to GC Roots”, which can help you see which objects in the path are holding the most heap space (just remember to exclude weak/soft references, since they don’t prevent garbage collection.)
Looking at the path to GC root for a Tree$Element$Node object, we can see this:
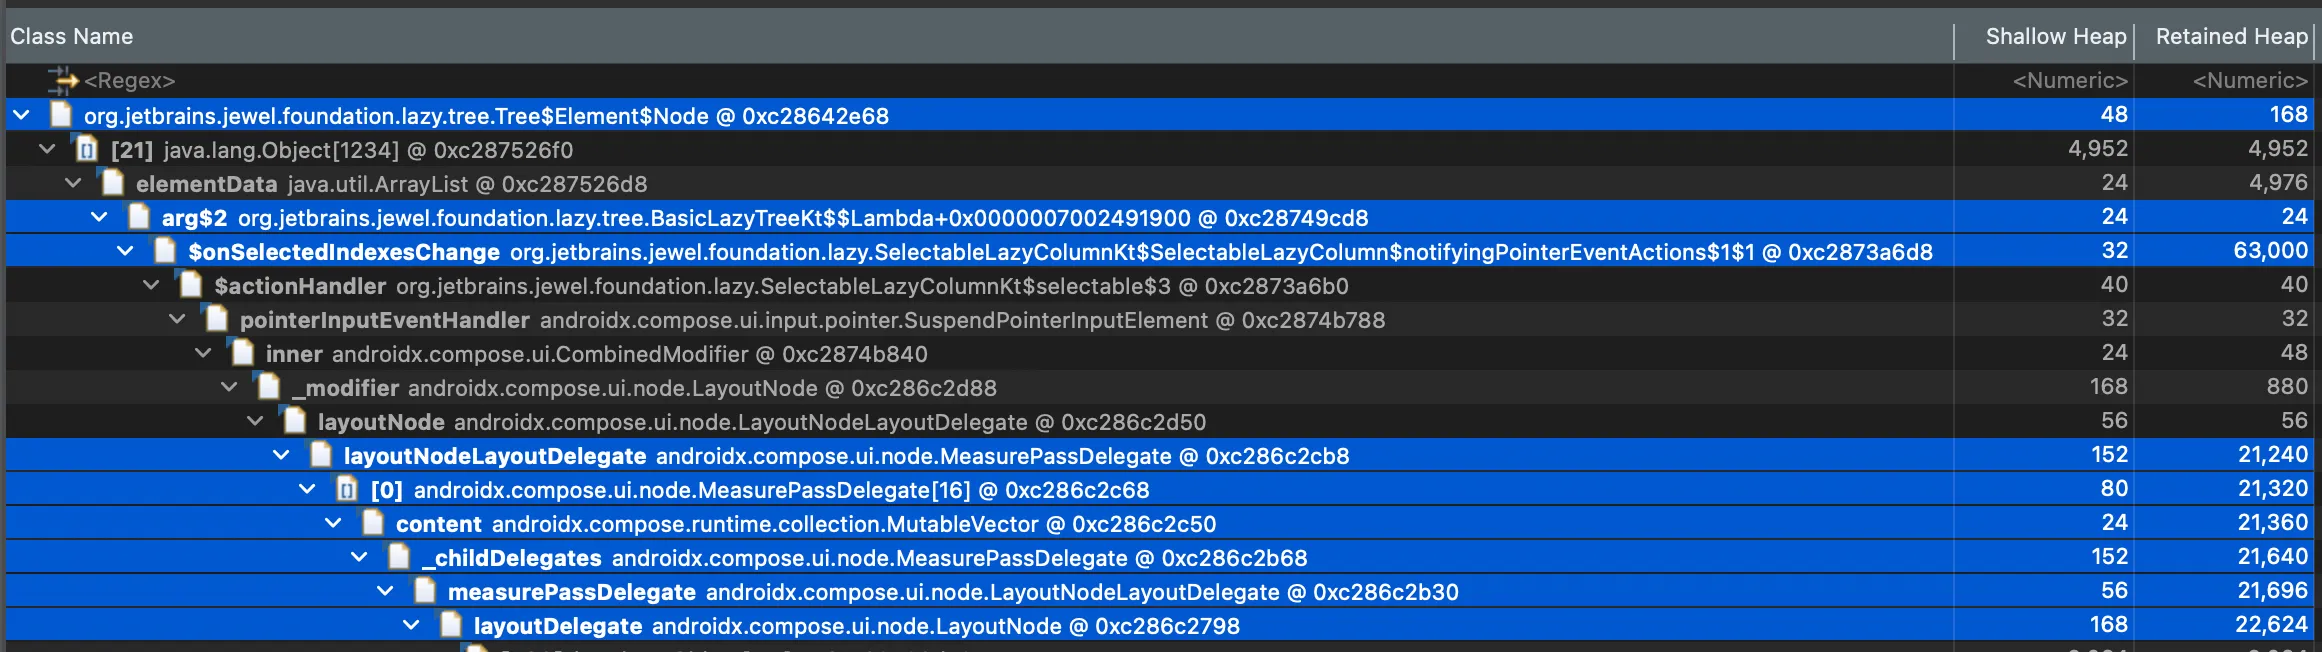
| Class Name | Retained Heap (bytes) |
|---|---|
| …jewel.foundation.lazy.tree.Tree$Element$Node | 168 |
(arg$2) …jewel.foundation.lazy.tree.BasicLazyTreeKt$Lambda | 24 |
(onSelectedIndexesChange) …jewel.foundation.lazy.tree.SelectableLazyColumnKt$notifyingPointerEventActions | 63,000 |
(layoutNodeLayoutDelegate) androidx.compose.ui.node.MeasurePassDelegate | 21,240 |
(measurePassDelegate) androidx.compose.ui.node.LayoutNodeLayoutDelegate | 21,696 |
(layoutDelegate) androidx.compose.ui.node.LayoutNode | 22,624 |
Don’t be scared by the amount of classes in the path. As you can see, the two suspicious classes here are Jewel’s
onSelectedIndexesChange and Compose’s layoutDelegate (and its parents). Here’s what’s happening under the hood:
RootNodeOwner(The root of the Compose UI tree)- …hold onto a
LayoutNode(A generic Compose UI element) - …which captures a lambda (
BasicLazyTreeKt$Lambda) - …which references a
Tree$Element$Node
We can rule out any wrongdoing on Compose’s side since the retained heap on its classes it’s to be expected.
Every single piece of UI in Compose, from Text to Rows is backed by a LayoutNode under the hood
and they do a bunch of heavy lifting like calculating the exact X/Y pixel coordinates for drawing, retaining its child
UI elements and the entire chain of modifiers.
Now, the weird bit is the onSelectedIndexesChange retaining 63kB. That’s the boundary between Compose being done
doing what they have to and letting us do our thing. Our BasicLazyTree lambda is secretly holding this massive
retained heap.
We can pair our findings with the fact that there’s a little over 7 thousand Tree$Element$Node objects being retained,
which means that Compose is being unable to reuse these LayoutNodes. This means that Compose’s LazyColumn is
basically storing each and every single tree element as an unique UI layout in its reuse pool, rendering its recycling
capabilities useless.
Why?
The Culprit
Alright, we can start investigating what might be inflating the number of nodes in our tree:
@Composable
public fun <T> BasicLazyTree(
    tree: Tree<T>,
    treeState: TreeState = rememberTreeState(),
    // ... a bunch of parameters
) {
    val flattenedTree: List<Tree.Element<T>> = remember(tree, treeState.openNodes, treeState.allNodes) {
        tree.roots.flatMap { it.flattenTree(treeState) }
    }

    SelectableLazyColumn(
        // ... other parameters
        onSelectedIndexesChange = {
            onSelectionChange(
                it.map { element -> flattenedTree[element] as Tree.Element<T> }
            )
         },
    ) {
        itemsIndexed(
            items = flattenedTree, key = { _, item -> item.id }, contentType = { _, item -> item.data },
        ) { index, element ->
            // Tree node layout
        }
    }
}
Now, you could probably spot the root cause for this memory leak just by looking at the code snippet above, but it’s not as obvious as it might seem.
See, the real issue here is our contentType = { _, item -> item.data } code. From Compose’s KDoc on the items
function:
- @param contentType a factory of the content types for the item. The item compositions of the
- same type could be reused more efficiently. Note that null is a valid type and items of
- such type will be considered compatible.
Basically, Compose keys contentType into its caching system. Given that in our repro every single item has a unique
string:
newElems += TestTreeNode(
    bar = lastBar + it,
    foo = "foo${lastBar + it}", // <--- here!
)
The Smoking Gun
By passing item.data as the contentType, every single item has a 100% unique content type. Because of that,
LazyColumn creates a brand new reuse bucket for every single item that is ever removed. This means that Compose is
caching exactly 1 node per bucket, and since there are hundreds of thousands of unique buckets, it holds onto every
single old Tree.Element forever. Oh my.
At least the fix itself is pretty straightforward: let users declare the content type and use the class type as a default:
contentType = { _, item -> item.data?.let { it::class } }
The Accomplice
Awesome! This explains the huge number of tree nodes being hoarded by Compose… But, how does that explain our
onSelectedIndexesChange lambda holding onto 63kB of memory?
Let’s zoom in on our lambda:
onSelectedIndexesChange = {
    onSelectionChange(
        it.map { element -> flattenedTree[element] as Tree.Element<T> }
    )
}
This lambda is implicitly capturing the flattenedTree variable from the outer scope. flattenedTree is a
List<Tree.Element<T>> containing a snapshot of our entire expanded tree. In the JVM, an ArrayList holding about
7,000 object references takes up about 60kB-65kB (in a 64-bit JVM, a pointer has 8 bytes)
and voilà, that 63kB is the entire flattened list of nodes!
See, this is where a daunting domino effect occurs everytime we hit the “Add many items” button:
- Our code builds a brand new
flattenedTreelist (63kB) - It creates a lambda capturing that exact list
- Compose creates new
LayoutNodes for the screen and attaches the lambda via a click modifier. - The old items scroll off-screen, but because of our
contentTypebug, their oldLayoutNodes are thrown into an infinite caching pool and are never destroyed. - Because the old UI nodes never die, their old modifiers stay alive.
- The modifiers keep the old lambdas alive.
- The old lambdas keep the entire previous 63kB flattenedTree snapshots alive in memory forever.
The same contentType fix also fixes this though, since now when old items scroll off-screen, Compose discards the old
LayoutNodes (and its modifiers), so GC can finally sweep away the old lambdas along with the 63kB flattenedTree
with them.
The Verdict
By simply using the data class as the content type, we get rid of the leak. This way, Compose can cap the reuse
pools to exactly two buckets (Tree.Element.Node::class and Tree.Element.Leaf::class, the only two types of
Tree.Element<T> our Tree.kt has). Now Compose will only ever recycle an old Node layout for a new Node,
and an old Leaf layout for a new Leaf.
After applying the fix, dumping the heap and checking the results, this is what we have in the Histogram tab:
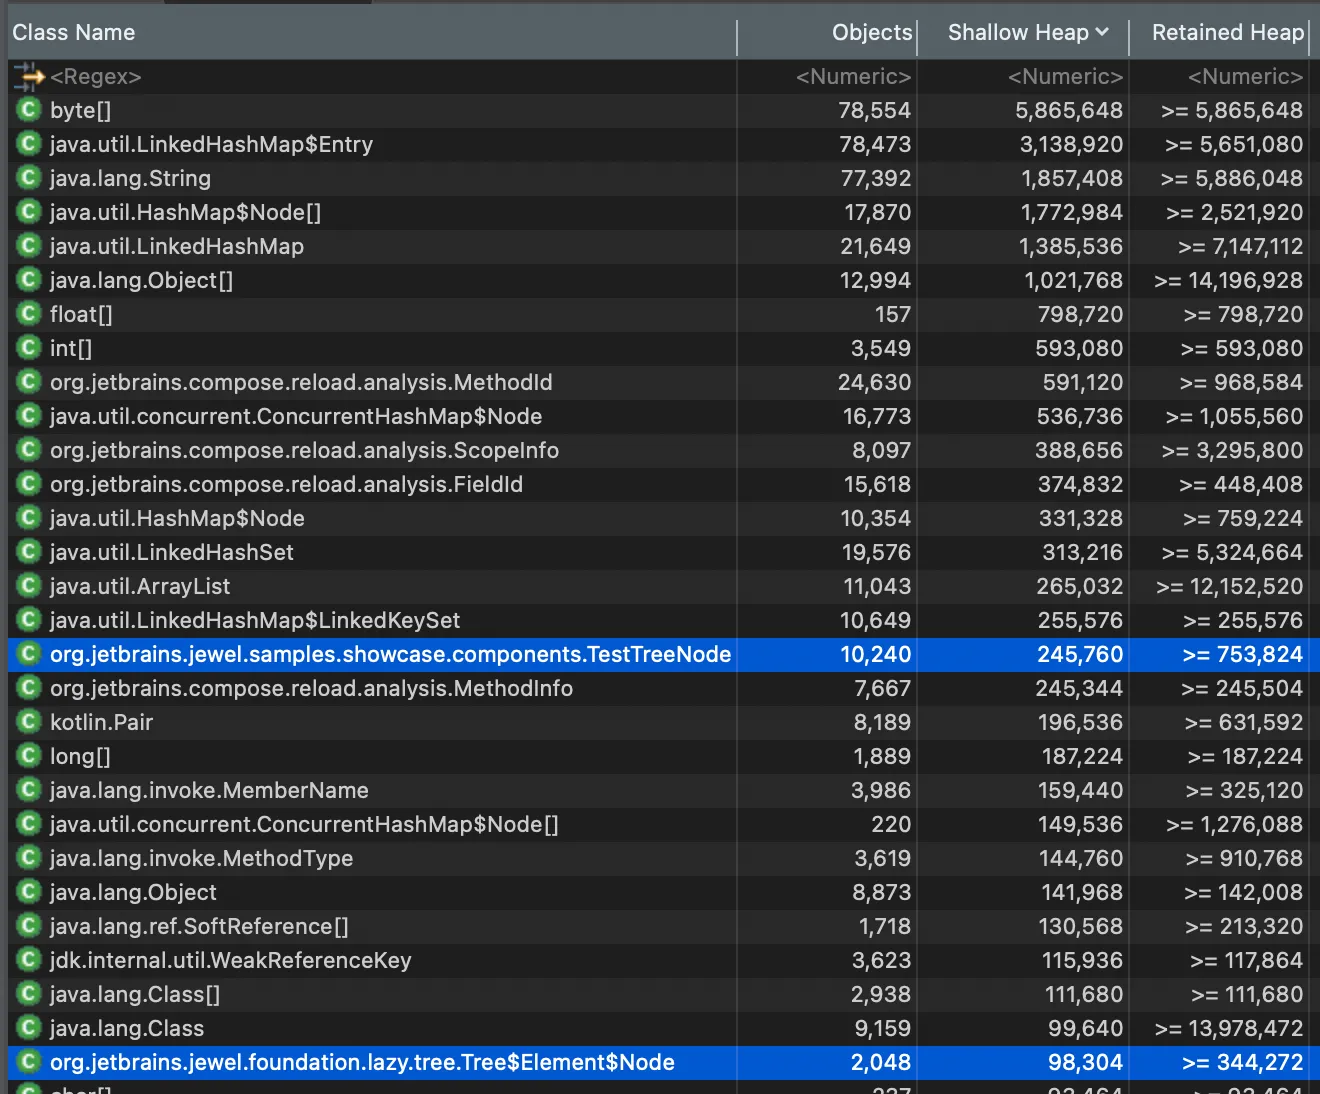
| Class Name | Objects | Shallow Heap (bytes) | Retained Heap (bytes) |
|---|---|---|---|
| TestTreeNode | 10,240 | 245,760 | >=753,824 |
| Tree$Element$Node | 2,048 | 98,304 | >=344,272 |
Comparing the before and after:
| Class Name | Retained Heap (before) | Retained Heap (after) | Decrease percentage |
|---|---|---|---|
| TestTreeNode | ~1,088,904 | ~753,824 | ~31% |
| Tree$Element$Node | ~1,194,256 | ~344,272 | ~71% |
And just like that, we improved our tree by ~71%, which is a huge performance gain. No more muddied reuse pool, just enough elements so that Compose can render all items without stuttering.
If we check the shortest path to GC, we have this:
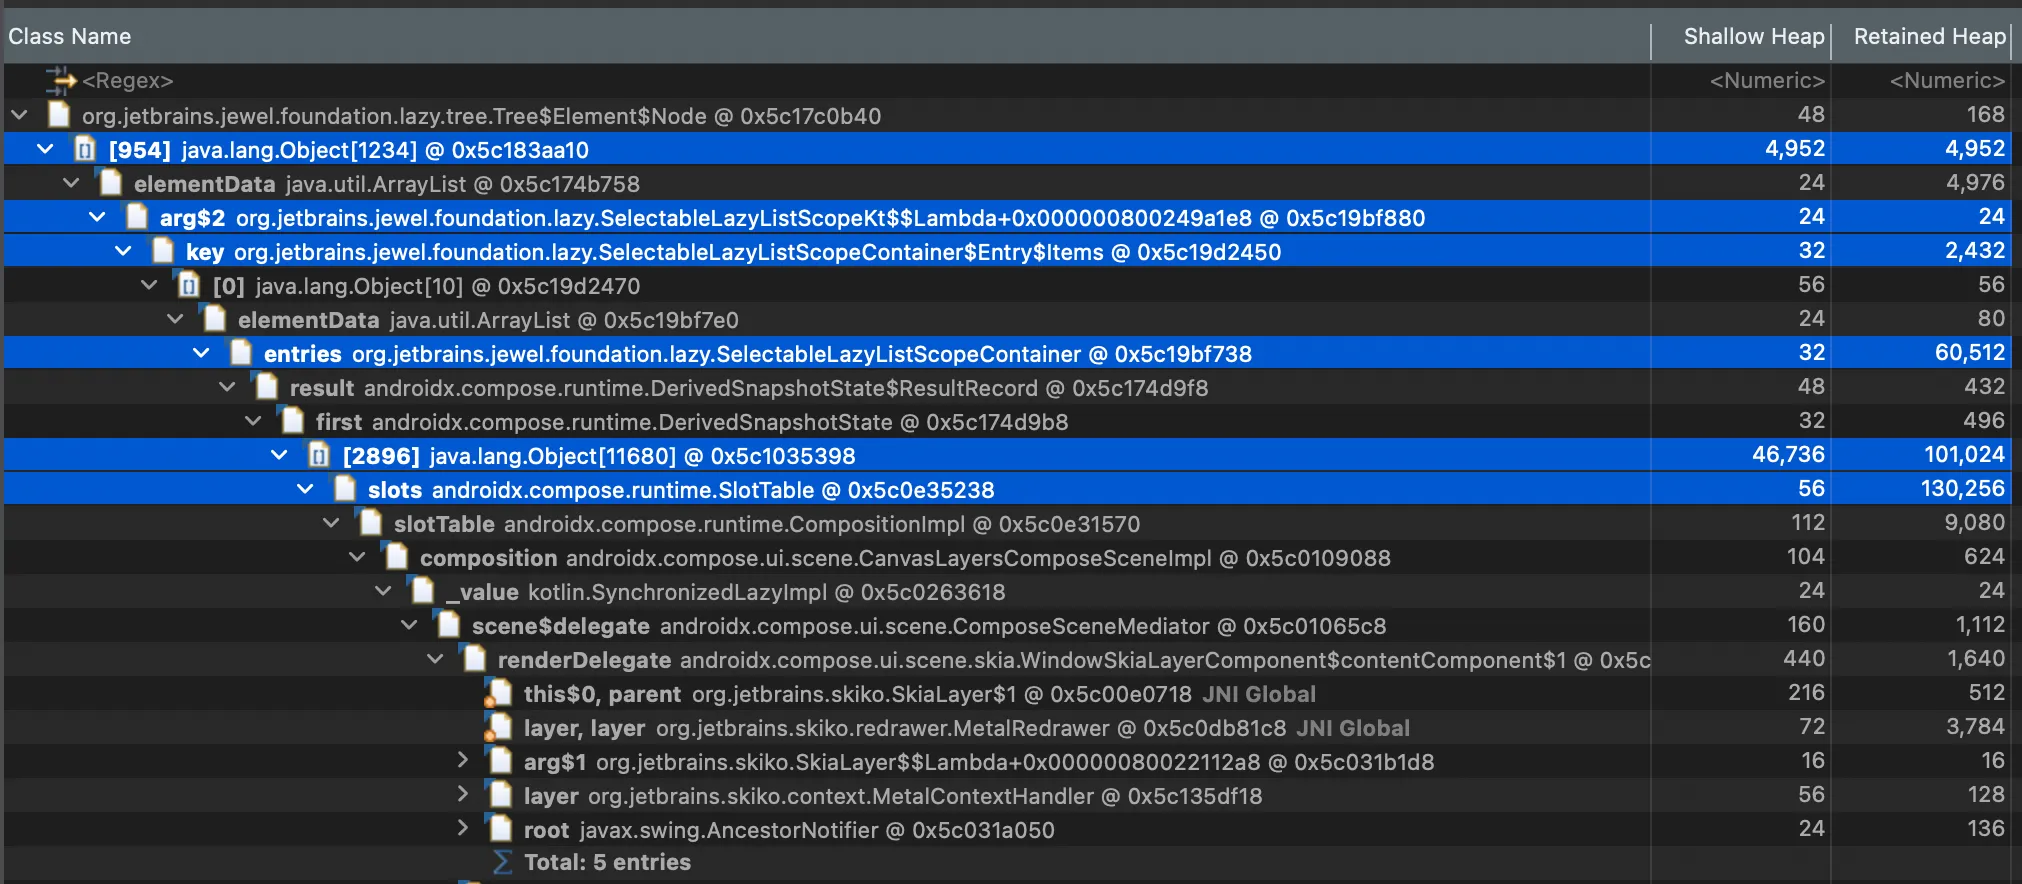
Notice that the path doesn’t reference BasicLazyTree anymore. The shortes path to GC defaults to the state side of
Compose (SlotTable).
Another difference is that the path references SelectableLazyListScopeKt$$Lambda. This is the lambda generated by
the itemsIndexed block inside the SelectableLazyListScope DSL. The SlotTable kept this lambda around because it
needs to know how to build the list structure, but it only keeps the active state, not a thousand of dead copies.
For the ~31% decrease in retained heap for TestTreeNode, we made a few changes that ultimately knocked it down by
~71%. Parts of our code was creating temporary ArrayList in memory for every single iteration of flattenTree() or in
the function that gets all subnodes by changing a filterIsInstance to a forEach, making the function
zero-allocation.
Case Closed
Memory leaks can be quite sneaky or a little bit daunting to hunt down, but don’t be intimidated by them. Yes, it is a bit confusing to properly map out the histogram or the shortest path to GC into the code you actually wrote, but once it clicks, it can not only help you out with a real issue, it can also make some less obvious issues a lot more obvious.
This story serves as an important reminder:
If your contentType is ever derived from any value that is unique per item
across the lifetime of the list it will poison Compose’s reuse pool.
The coolest thing about this whole process was that, by trying to find the root cause of one bug, we wound up finding another two extra optimizations that we weren’t even looking for, and that’s a good note to end on:
Heap analysis isn’t just confirming the bug you already suspect. It’s the stuff you didn’t know to look for.
- Tags:
- kotlin-multiplatform